How it works
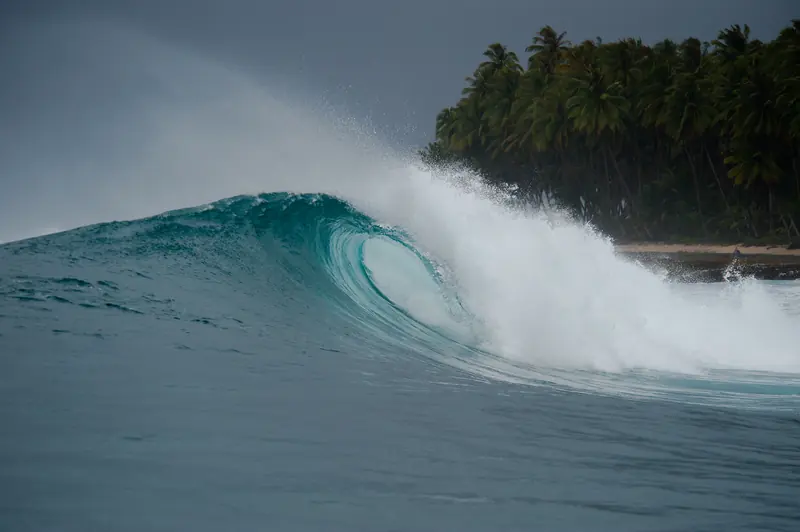
Every daylight hour at every break you've saved gets a score out of 10. Three things go into it — swell, wind and tide — each measured against what you told us your break wants. They're weighted, added, and then the whole thing is pulled down toward whichever one is worst. That last step is the part most forecasts skip, and it's the reason a BommieSurf score doesn't flatter a day that has one thing badly wrong with it.
Swell counts for 45%, wind for 35%, tide for 20%.
Those are the numbers, and we publish them because the weights were never the clever part. Any forecast can weight three inputs. What makes a score yours is the thresholds underneath them — your swell range, your wind directions and tolerance, your tide sweet spot — and those you set, per break.
A weighted average is too forgiving. It lets a perfect tide and a glassy morning paper over a swell that isn't there, and you end up driving to a flat ocean on a 6.
So after the weighted sum, the score is multiplied by a limiting factor built from the worst of the three components. A day where everything is adequate beats a day where two things are perfect and one is hopeless. That matches how it actually works in the water.
Day one: the swell is barely there, but the tide is exactly where you want it and the wind is dead offshore.
Day two: a solid swell, the tide right in your window, and the wind is wrong.
And the day that beats both: nothing special, nothing wrong. Every component middling.
Neither of the first two is worth the drive, and an averaged rating would have told you otherwise.
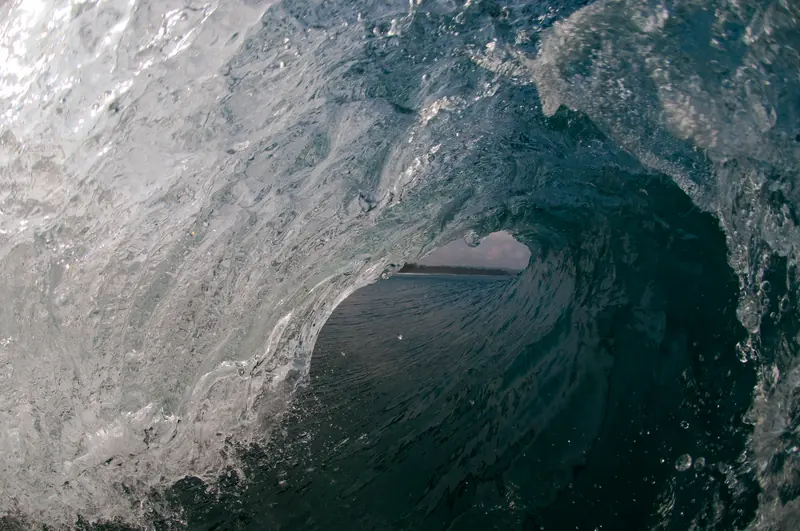
Most forecasts draw you a tide curve and leave the rest to you. If you've surfed one break for any length of time you already know the tide isn't background information — it's often the whole decision.
So tide is a scored component here. You set the sweet spot as a position between low and high, say whether the break wants it rising or falling, and mark it critical if the break simply doesn't work outside that window. Each break can draw from its own tide station, because the one nearest the pin isn't always the one that matches the break.
The next best session only ever points at hours you could actually surf. Scoring the dark would produce a higher number somewhere in the middle of the night and it would be useless, so those hours aren't offered.
Firing is 7 and above. Fun is 5.5 and above. Marginal is 4 and above. Below 4 is Poor.
The bands exist so you can read a week at a glance. The number is the thing that's actually calculated.
The forecast runs nine days because that is as far as the marine model reaches. Longer horizons exist on other apps. They're extrapolation past the point where the wave model has anything to say, and we'd rather show you nine days you can plan around than fourteen where the last five are decoration.
It doesn't know the sandbank moved. It doesn't know about the swell that came through yesterday and left the surface a mess. It doesn't know how many people are already out.
It reads the models against the rules you set, hour by hour, and tells you when those rules are met. Local knowledge is still yours to supply — the app is a way of recording it so you don't have to re-derive it at 5am.